Debugging Blazor Applications
We will be discussing how to debug both a server side Blazor
application as well as a Client-side Web Assembly application.
Client-Side Web Assembly
To debug this type of application we will be using the browser
tools to access the C# code. As of this
post, only Chrome supports debugging the web assembly client application. Microsoft Edge can be used, but it just fires
up a chrome instance to debug with.
Steps to debug:
1. Create a client-side web assembly application
from the standard Blazor templates that are provide with Visual Studio or
Visual Code
2. Run application in Chrome
3. Press F12
4. You will see a comment to press Shift – Alt – D to
debug
5. Make sure you click on the actual Blazor
application
6. Press Shift-Alt-D
7. A new browser tab will be displayed.
a.
If you do not see any errors, congratulation you
are good to go. Jump to step 8.
b.
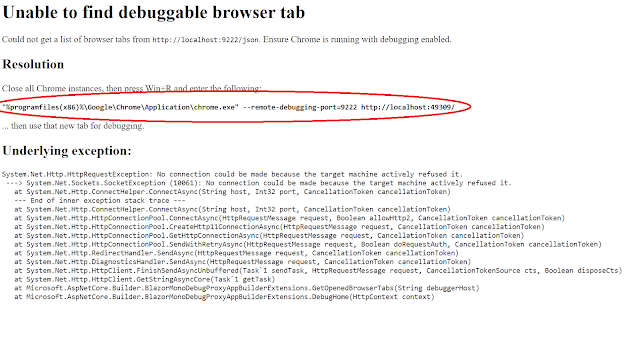
If you see this error, Follow the steps below
c.
You need to copy the URL highlighted. Please note that your URL will be different, and
you need the listed for your projects.
d.
Close ALL the Chrome browsers you have open
e.
Go to the task manager and look for any Chrome
related process running and kill those
i.
All chrome processes must be stopped to get this
to work
f.
Press Win+R
g.
Paste in the URL and press enter
h.
Press Shift-Alt-D
8. A new developer tab will be displayed
9. Go to source
b.
Expand the “Pages” node
c.
Click on Counter.razor
d.
You should be able to see your C# code.
10.
Set a break point on currentCount++
11.
Go to the Counter page in the application
12.
Click the “Click me” button and see the browser
hit the break point
13.
You can now step through the code like any other
client-side debugging session.
Server-side Application
The server side is much easier to debug. You debug it like a normal server-side
application.
Steps to Debug
1.
Create a client-side web assembly application
from the standard Blazor templates that are provide with Visual Studio or
Visual Code
2.
Run application in Chrome
3.
In Visual Studio
a.
Set a break point on the currentCount++ line.
4.
Go to the Counter page in the application
5.
Click the “Click me” button and see the browser
hit the break point
6.
You can now step through the code like any other
Visual Studio debug session.
Following this steps you should be able to debug either type of Blazor application. I have found if I can walk the code it make things so much easier to understand.


%20built%20with%20Blazor.%20The%20scene%20features%20a%20dynamic%20web%20app%20running%20o.webp)

Comments
Post a Comment